0x019 - OpenTelemetry 📡

Get more 5-minute insights about dev trends every 3-4 weeks. To subscribe you need to code your way there via the home page (or the easy way here)...
👉
OpenTelemetry
Synonyms: Distributed tracing, observability.
✅
Who is this for?
- SREs, DevOps, and anyone touching production or do any type of debugging (yes, yes locally too).
- SREs, DevOps, and anyone touching production or do any type of debugging (yes, yes locally too).
TL;DR:
- Problem: Keeping an eye on your apps and infrastructure during runtime is a difficult mission.
- Solution: OpenTelemetry is a standardized framework to generate and process telemetry data, an open-source project under the CNCF.
- In Sum: OpenTelemetry has a big ecosystem to support it. It still needs some polish, but probably your best bet for anything telemetry-related.
How does it work? 💡
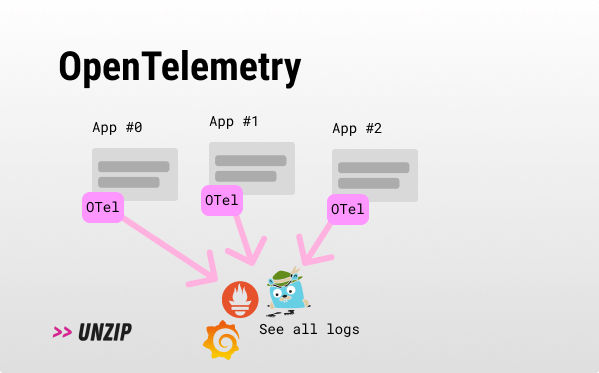
At its heart, OpenTelemetry (OTel) sets a standard that telemetry information should follow. It is a way for systems to communicate what is happening inside of them, making these systems observable - helping us understand how well they operate and what their behavior is like.
OpenTelemetry focuses on three main types of telemetry information: logs, metrics and traces (soon also continuous profiling) - and outlines how the structure of observable systems should look like. The standard offers a bunch of SDKs that provide a way to instrument (explained below with code) commonly used packages and libraries you use daily in production (e.g. HTTP fetch, or SQLite database functions), and trace events on distributed systems at runtime, exporting metrics that are useful for debugging, health, and performance. It instruments the common interesting functions during runtime.
When I first used OTel, I was wondering how it actually exports telemetry data from my application. The way it does it is by instrumentation (patching functions during runtime).
Here is a quick code snippet that shows how the automatic instrumentation works. This is simplified code from the pg instrumentation:
// We don't want to patch (`wrap`) twice
if (isWrapped(moduleExports.Client.prototype.connect)) {
  this._unwrap(moduleExports.Client.prototype, 'connect');
}

// We wrap the pg.Client with our own `_getClientConnectPatch` which adds info
// such as where we are connecting to and timestamps...
this._wrap(
  moduleExports.Client.prototype,
  'connect',
  this._getClientConnectPatch()
);
Once the data is gathered, OTel then exports it to a 'backend' either directly from the instrumentation or via a Collector - which is preferred in higher scales because it takes care of additional handling like retries, batching, encryption or even sensitive data filtering.
The data you are sending uses the OTLP protocol - a specification on how to encode and transport OTel’s information. Your data then arrives in your chosen backend (e.g. Prometheus, Jaeger, or any other observability platform). This is where OTel’s role ends. The storage, visualization, and analysis of this data are left to your chosen platform or tool - no vendor locking (!).
Another way to think about OTel is as the end game for all observability & monitoring formats - one king format to rule them all, which everyone will have to eventually support. A common comparison is CycloneDX in the world of SCA and SBOM generation.
For a more in-depth intro, check out the Beginner’s Guide to OpenTelemetry by Dotan Horovits.
Questions ❔
- OpenTelemetry vs OpenTracing/OpenCensus?
- OpenTracing and OpenCensus were both merged into OpenTelemetry.
- OpenTelemetry vs APM?
- APMs can leverage OTel, they are a platform not a standard. APMs are focused on application performance, not standardization, instrumentation, distributed observability scale, and being vendor neutral.
- What kinds of telemetry does it support?
Why? 🤔
- Standardization: OpenTelemetry offers an open-source standardized approach to collecting telemetry data from a variety of sources - which also means you aren’t vendor-locked to a specific backend.
- Prevalence: As an industry standard, OpenTelemetry has wide community support in many major programming languages and frequent updates.
- Monitoring: OpenTelemetry helps you be visible to your application’s health and performance during runtime, adding informative context to your monitoring.
Why not? 🙅
- Potential Overhead: May add overhead to your applications.
- Limited Support: Not all packages you use or write have auto-instrumentation, meaning you might not be able to see their data without wiring your own instrumentation.
- Learning Curve: OpenTelemetry, like any new concept, demands time to understand and implement.
- No Storage Visualization: It focuses on telemetry data and leaves data storage and visualization to other tools - not really a con, but part of the definition.
- Early-stage Project: Still evolving; future changes might affect your setup.
Tools & players 🛠️
- OpenTelemetry: The umbrella project for OpenTelemetry.
- Example backends: Prometheus, Jaeger, Grafana, Zipkin.
- Major players in the space: Datadog, NewRelic, Lightrun, Dynatrace, Lumigo, Logz.io, SumoLogic, Signoz, ServiceNow, HyperDX, Splunk, traceloop, Honeycomb.
🤠
My opinion: Jaeger was a handy tool last time I had to deal with OTel shenanigans. Other than that, use whatever tool seems nicer and has a decent amount of traction.
Forecast 🧞
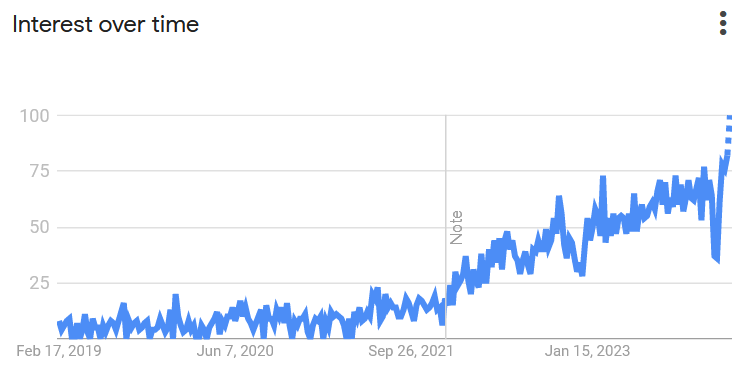
- Market domination: Open Census and Open tracing both merged into OpenTelemetry, showing that it is the dominant player in the observability space right now. OpenTelemetry has become the 2nd most active CNCF project after Kubernetes. All major cloud providers have support for OTel (Azure even uses it internally). This means that all telemetry data could potentially be collected by OTel, nothing more.
- Security push: OTel is mostly used for performance, debugging, and health needs, but I can see how relevant players will start utilizing OTel for security-related work.
- OTel might enable a new industry of “run time” application analysis like there is for static code analysis.
- eBPF and OTel: eBPF can be used together with OTel quite nicely.
- Better docs: The general sentiment right now isn’t very positive in terms of DX and the OTel docs, I suspect to see them improving soon.
- LLMs: With vast data coming from Open Telemetry, I can see how LLMs will become a great sidekick to analyze and act on open telemetry data. Might LLMs detect and prompt you to fix code in production by analyzing OTel indicators?
- Binary tracing: Roy Feldman raised a cool idea when I talked to him about this issue, where OpenTelemetry could be hooked up with Frida to create exporters for binary applications without any source code present (a bit like cryptoshark).
Extra ✨
Additional information that is related:
- Open Telemetry in 2023
- Openllmetry - Open Telemetry for your LLMs.
- Awesome-open-telemetry.
- How manual instrumentation works (when there is no auto instrumentation available).
Thanks 🙏
I wanted to thank @TomGranot (the best growth person I know), Ben (A good friend, working at a company in stealth leveraging OpenTelemetry👀 - if you want to work with one of the best SO users I know IRL - email him), and Dotan Horovits (Ambassador at the Cloud Native Computing Foundation, OpenTelemetry activist and chief evangelist for Logz.io observability provider - gave tons of advice here, thanks!).
EOF
(Where I tend to share unrelated things).
💛
@hunter a friend, a writer and a solo maker that created UserSketch.
If you have a SaaS, you probably want to check it out.
If you have a SaaS, you probably want to check it out.